Actionable Information – Research Briefs – 5 – Summary and Assessment of Weather Information Services
Suggested citation:
Allen, A., Medina-Cetina, Z., Pompelli, G., Cochran, M., Alvarado, J. & Z-Losoya, E. (2021). Actionable Information – Research Briefs – 5 – Summary and Assessment of Weather Information Services. https://r7-cbts-sgl.engr.tamu.edu/actionable-information-research-briefs-5-summary-and-assessment-of-weather-information-services/
@misc{Allen2021A,
   author = {Allen, Alexi and Medina-Cetina, Zenon and Pompelli, Gregory and Cochran, Matthew and Alvarado, Juan Pablo and Z-Losoya, Enrique},
   title = {Actionable Information - Research Briefs - 5 - Summary and Assessment of Weather Information Services},
   url={https://r7-cbts-sgl.engr.tamu.edu/actionable-information-research-briefs-5-summary-and-assessment-of-weather-information-services/},
   year={2021},
   month={May}
}
This research brief includes a summary of various weather information services including a generalization of how they obtain and generate their data and a breakdown of the information they provide to determine which service would be preferred for use in the Dashboard. This brief is a summary and generalization of the data gathered from publicly available information provided by the weather information services investigated. A recommendation is provided at the end, but it is based on the reported weather data provided by the service and the apparent ease of use of the service, not on the quality of the information provided or the effectiveness of the offered APIs (Application Program Interface).
- While most weather information services provide generic weather information such as temperature, barometric pressure, and precipitation, some also provide tracking of or short-term forecasts for natural threats such as tornadoes, hurricanes, flooding, fires, etc.
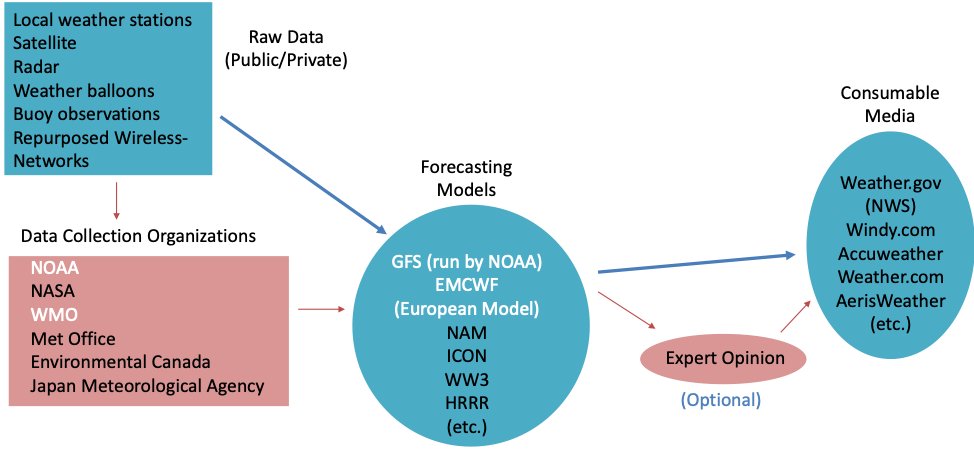
Figure 1: A flow chart describing the weather information services supply chain. The blue shapes are necessary steps; whereas, the pink shapes are optional steps based on the weather provider. The white text is emphasizing the most popular data collection organizations and forecasting models, respectively.
- Weather data is collected via satellites, radars, from locally and privately-owned weather stations, from buoy and weather balloon observations (Fig. 1). Novel weather collection methods also include refurbishing wireless-network devices to collect weather observations.
- This data is either collected directly by the weather dissemination services or more typically by government and international organizations such as the National Oceanic and Atmospheric Administration (NOAA), the World Meteorological Organization (WMO), the Meteorological Office (MET Office), etc. (Fig. 1).
- The raw data of current observations is then funneled through one or multiple weather forecasting models, the most noticeable of which are the GFS Model, which is primarily used for storm severity and path prediction, and the ECMWF Model, which is better for general weather forecasting (Fig. 1). Then, if desired, meteorologists will consult the model results and formulate what the most accurate forecast is in their opinion. Then weather information services will provide this data to the public either through a paid API service or for free with advertisements on a web-based platform.
- Based off of a papers reviewed in (Allen et al., 2021) Table 2, it was determined that the most impactful natural threats for us to obtain data on were flooding, fire regime, seismic activity, hurricanes, drought, storms, rainfall, tsunami, temperature, surges, greenhouse gas concentration, sea level, and volcanic activity.
- The most recommended companies offering these weather information services at which we looked were Windy.com, Accuweather, The Weather Channel, Open Weather Map, Climacell, Stormglass, AerisWeather, World Weather Online, and Weather Bit.
- The categories we used to access which service would provide us with the most relevant data included: what variables they offered, how many are on the current model, and how many of the notable natural threats were covered; what type of data was being offered (historical, current, forecast) for each variable; what methods they had to access the data; where they were getting their data; what models were they using to make their forecasts.
| API Service | Model Variables Offered (out of 33) | Total Variables Offered | From Most Mentioned Hazards (out of 13) |
|---|---|---|---|
| AerisWeather | 20 | 30 | 12 |
| The Weather Channel | 16 | 25 | 8 |
| Windy.com | 15 | 24 | 7 |
| Accuweather | 14 | 16 | 9 |
| Climacell | 13 | 18 | 6 |
| Stormglass | 12 | 23 | 5 |
| World Weather Online | 12 | 22 | 5 |
- AerisWeather, The Weather Channel, and Windy.com offer the most variables with Accuweather close behind (Table 1).
| All variables include historical, current, and forecast data | Most variables include current data and historical and/or forecast data | Most variables include current data but do not include historical and/or forecast data |
|---|---|---|
| Stormglass | Aeris Weather | Windy.com |
| Weather Bit | The Weather Channel | Accuweather |
| Open Weather Map | ||
| Climacell | ||
| World Weather Online |
- While Stormglass and Weather Bit offer the most well-rounded data types for their variables, the number of variables they include is significantly less than AerisWeather and The Weather Channel which both offer more historical/forecast data than either Windy.com or Accuweather (Table 2). This makes AerisWeather and the Weather Channel the top two weather information service providers that we investigated.
| Weather Information Service Name | Aeris Weather | The Weather Channel |
|---|---|---|
| Data Access Type | API and Mapping Platform | API |
| Data Origin | Government sources, proprietary services, personal weather stations, and public data | NOAA radar/satellites and alerts |
| Model Types | A blend of NDFD, GFS, NAM, etc. | Undisclosed |
- As AerisWeather appears to offer more of the data we are wanting to display on the dashboard (Table 1), I would recommend this service over The Weather Channel.
- The information in Table 3 is subjective based on an understanding of meteorology, to determine the best data provided, and computer science, to determine which company’s API service will be the most useful.
Weather Information Service Websites
AerisWeather
Accuweather
Climacell
Open Weather Map
Stormglass
The Weather Channel
Weather Bit
Windy.com
World Weather Online
https://www.worldweatheronline.com/


